Scottish Parliament election, 6 May 2021
A presentation of the results on a regional basis
The Scottish Parliament's electoral system uses a form of
proportional representation on a regional basis,
and therefore requires a regional analysis to understand.
Details for each of Scotland's 8 electoral regions are given below.
`Dramatic election - hardly any change'
I was going to present here a comparison between the results and
forecasts made in recent weeks by myself and others. But it has
turned out that a better prediction would have been to forecast
simply `no change'. The sum total of changes is as follows:
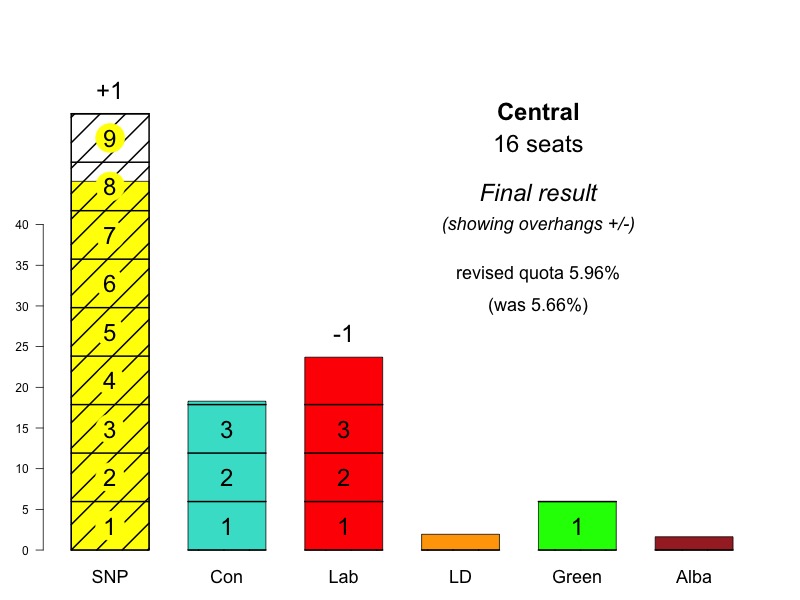
Central region: 1 seat from Lab to Green
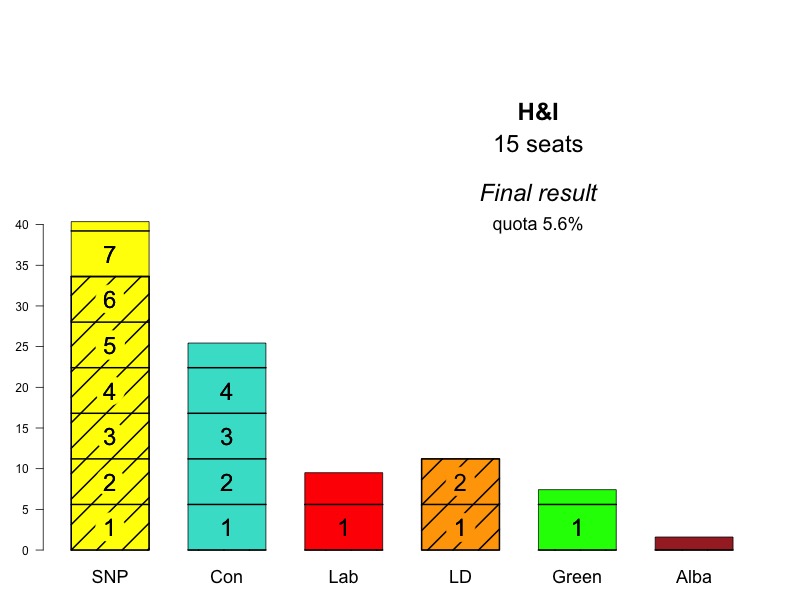
Highlands & Islands: 1 seat from Lab to Con
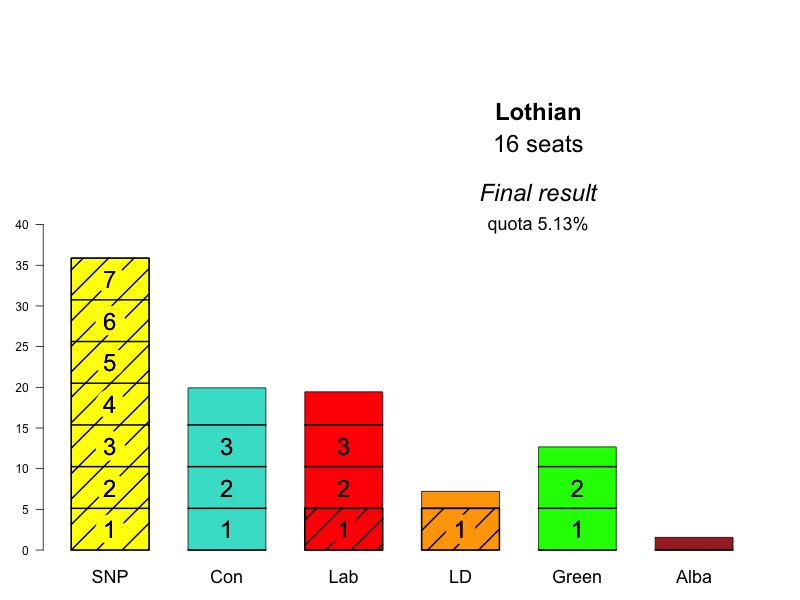
Lothian: 1 seat from Con to SNP
North East: 1 seat from LD to Green
Otherwise it was a case of the dog that did not bark in the night.
Three constituencies changed hands (Edinburgh Central, East Lothian
and Ayr), but none of these changes mattered: they were all in
regions where the list vote determined seat totals.
More interestingly, three very marginal seats that did
matter (Edinburgh Southern, Aberdeenshire West and Dumbarton - each
would have given the SNP a net gain) did not change hands.
While despite the SNP's list vote going down overall by the
equivalent of 2 seats, they made a gain of one seat, because in the
3 regions where they should have lost seats they were protected by
their constituency holdings, giving `overhangs' in these regions.
Regional analysis
   2021  SNP Con Lab LD Grn     2016 SNP Con Lab LD Grn

Central   9   3   3  0   1            9   3   4  0   0
Glasgow   9   2   4  0   1            9   2   4  0   1
H&I       7   4   1  2   1            7   3   2  2   1
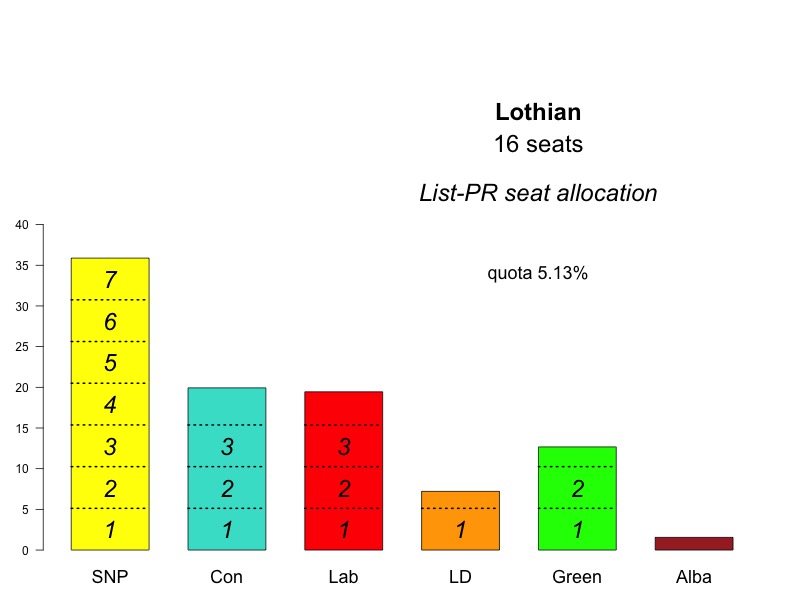
Lothian   7   3   3  1   2            6   4   3  1   2
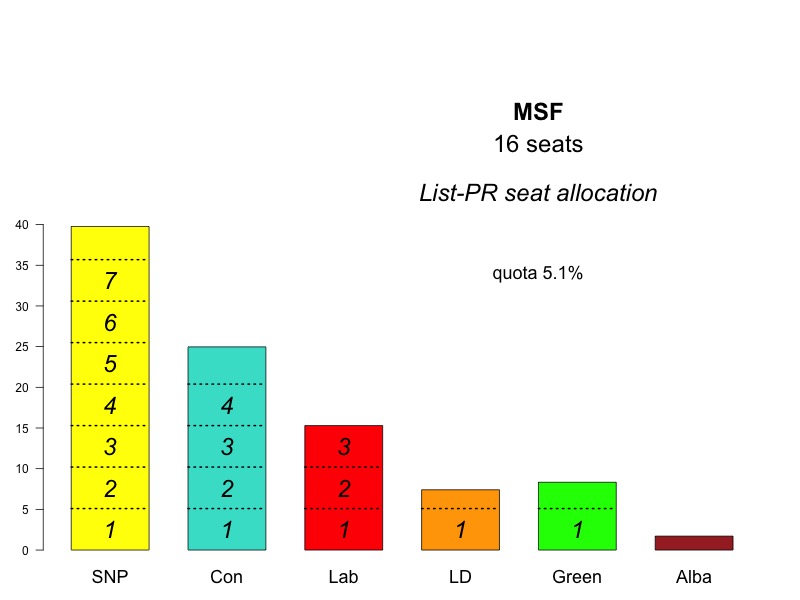
MSF       8   4   2  1   1            8   4   2  1   1
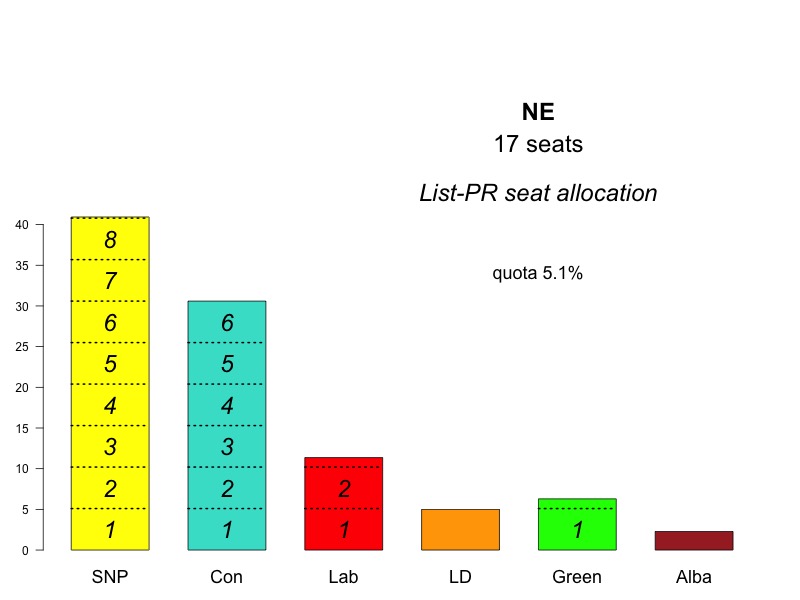
NE        9   5   2  0   1            9   5   2  1   0
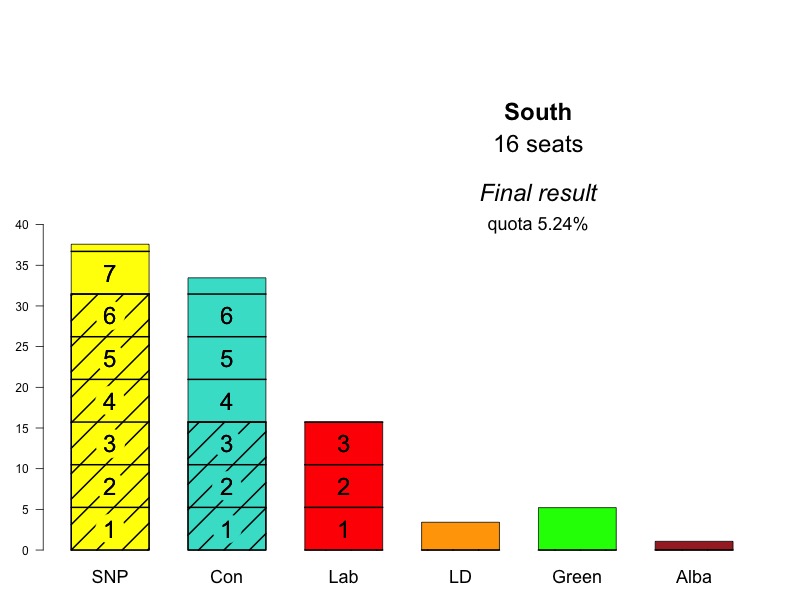
South     7   6   3  0   0            7   6   3  0   0
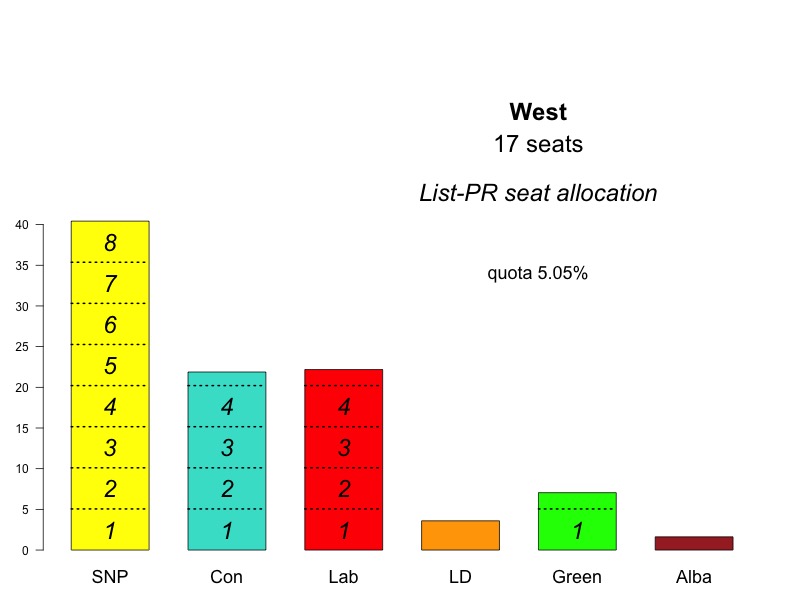
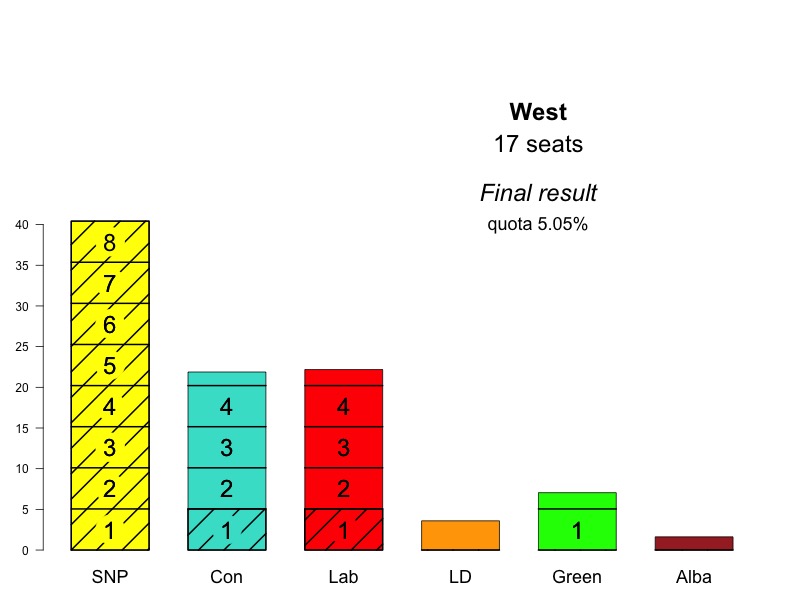
West      8   4   4  0   1            8   4   4  0   1

  total  64  31  22  4   8           63  31  24  5   6
A note on predictability:
The list-PR seat numbers can be estimated very accurately from the
overall list vote percentages, using the linear formula s = -4 +1.56
v. Here the intercept represents the loss on average of 0.5 seats per
region due to the rounding down in the d'Hondt system, while the slope
constant is the number of seats (129) divided by the percentage of
useful votes (that is, omitting surpluses and votes for unsuccessful
parties).
For the 2021 election, this gives seats (59 33 24 4 9);
adjusting for the 4 extra SNP `overhang' seats, which came at the
expense of Con 2, Lab 1 and Green 1, we get (63 31 23 4 8), which is out
by just 1 seat (SNP/Lab).
The implications are (1) that error in estimating list seat totals is
mostly due to simple polling error, and (2) errors in estimating
constituency votes only matter for marginal constituencies that could
cause or remove an overhang - a much more intractable problem,
especially as the very fact of being marginal means that they are
likely to deviate from national or regional averages.
The seat numbers in each region were exactly as the list votes on
their own would have determined, except for a few `overhangs' where a
party won more constituencies than warranted by its list vote.
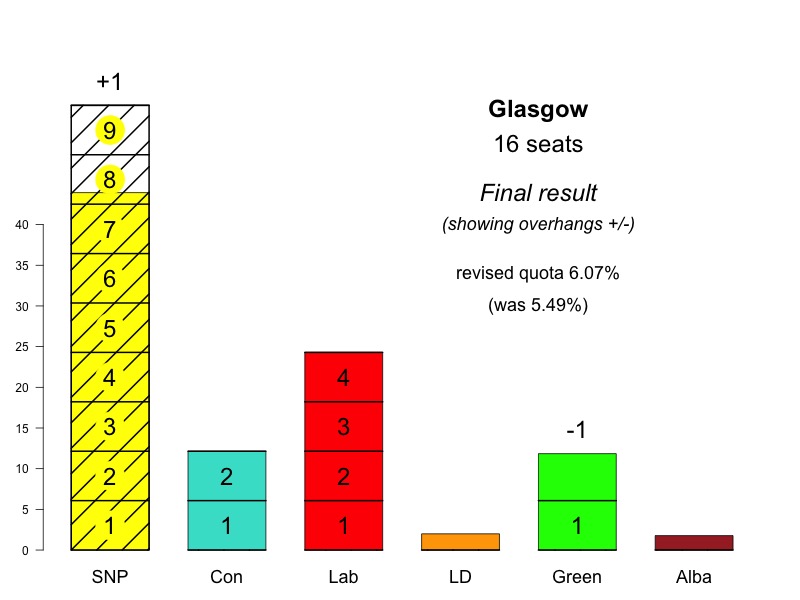
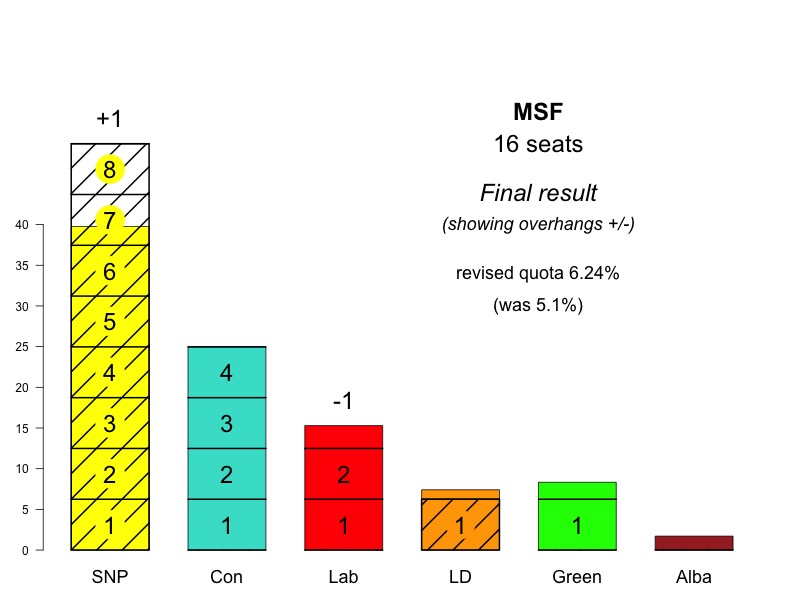
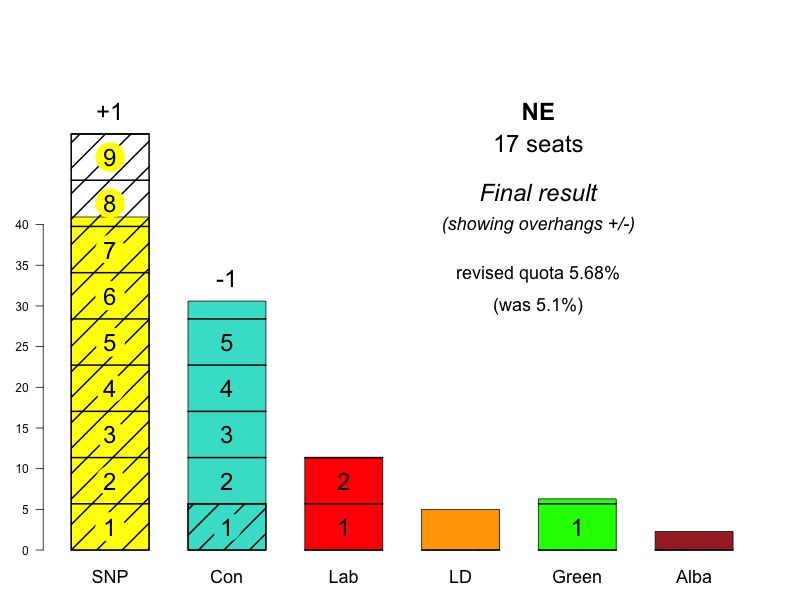
In 2021 there was one in each of 4 regions (C, G, MSF, NE), each
benefitting the SNP, at the expense of respectively Lab, Green. Lab and
Con.
In 2016 there was only one overhang, in MSF, benefitting the SNP at
the expense of Lab.
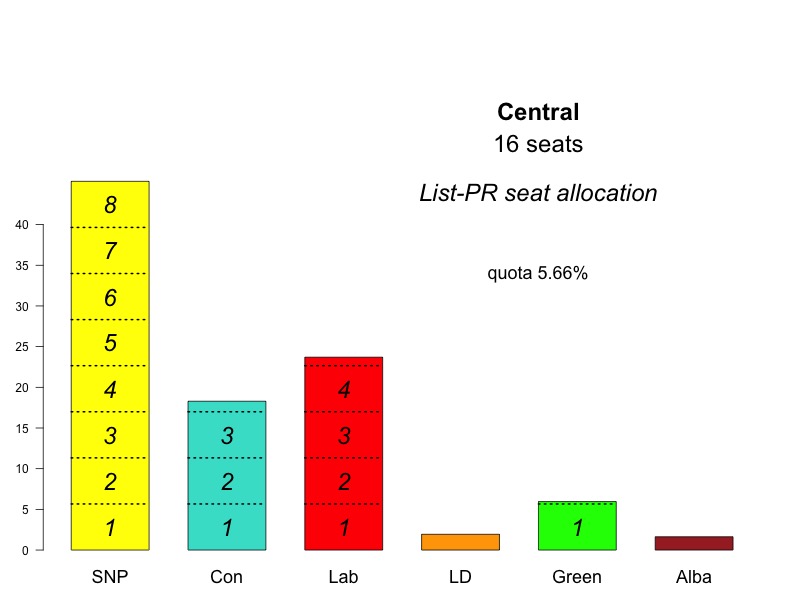
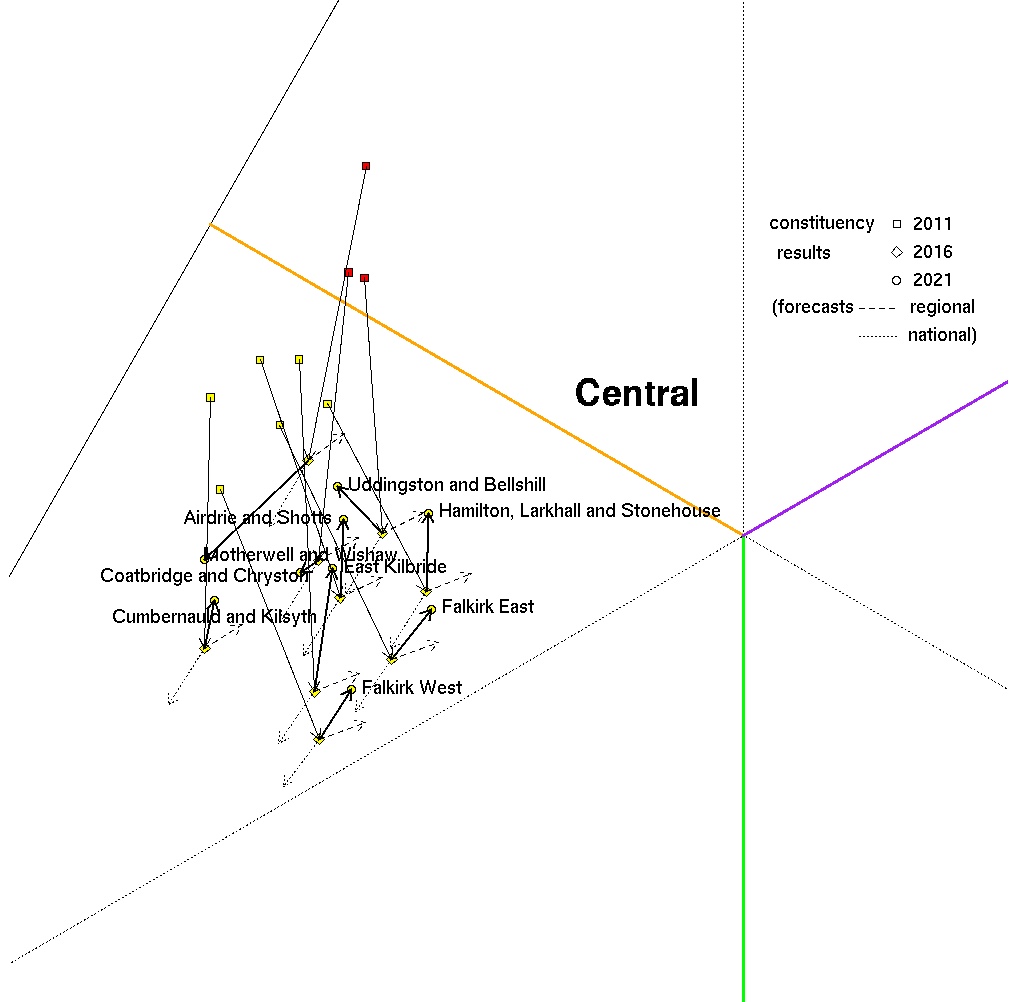
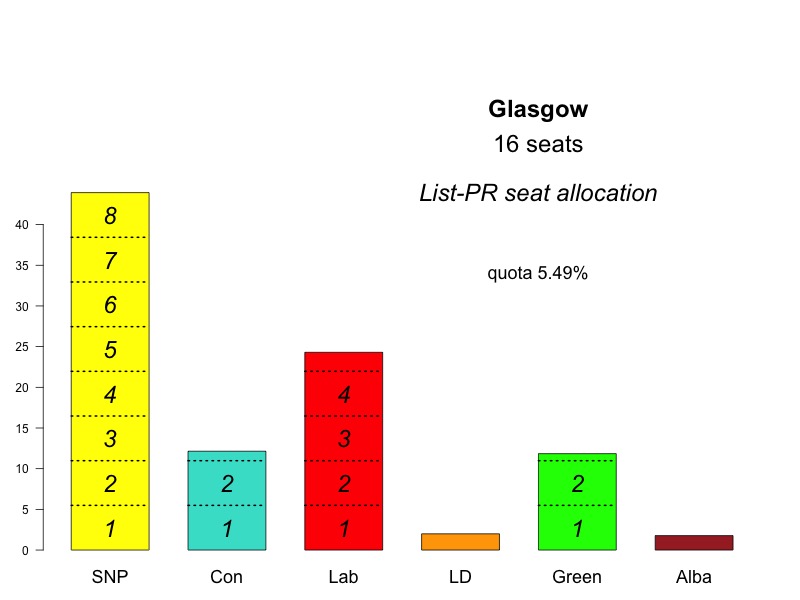
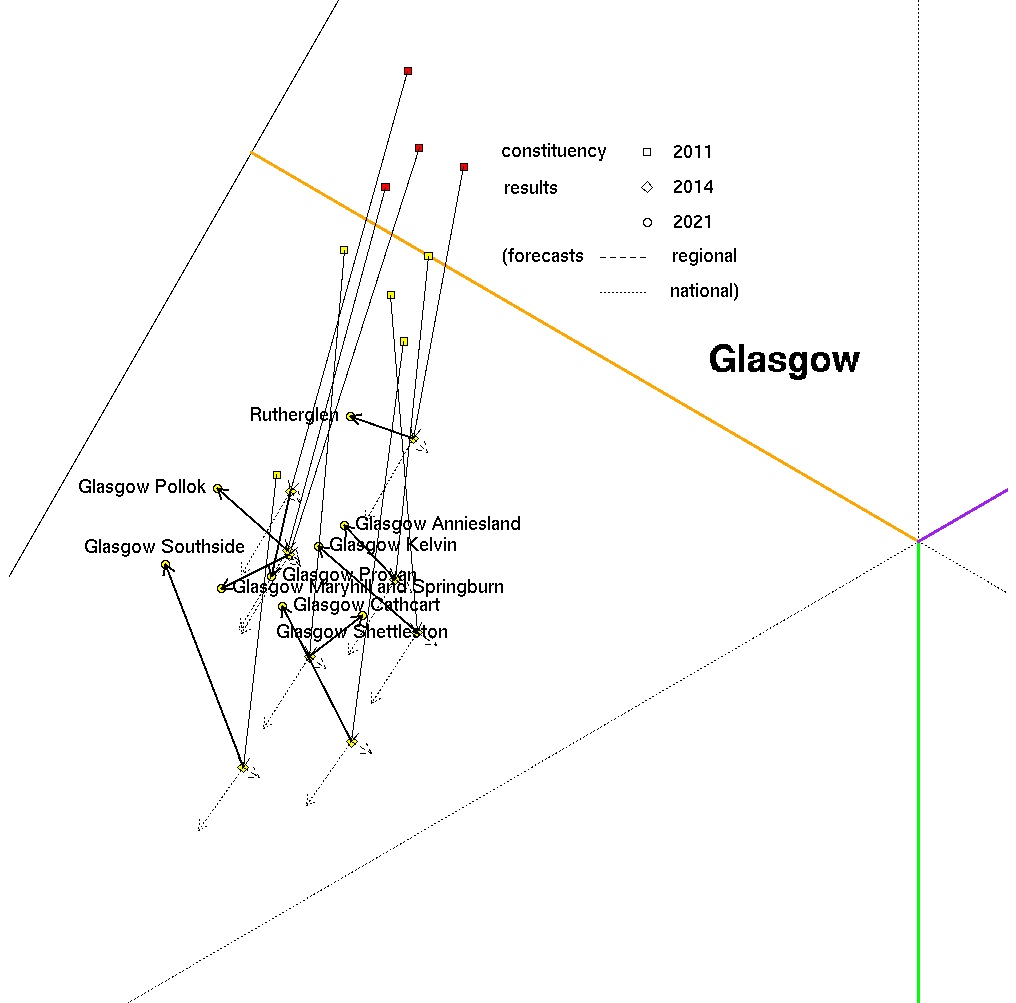
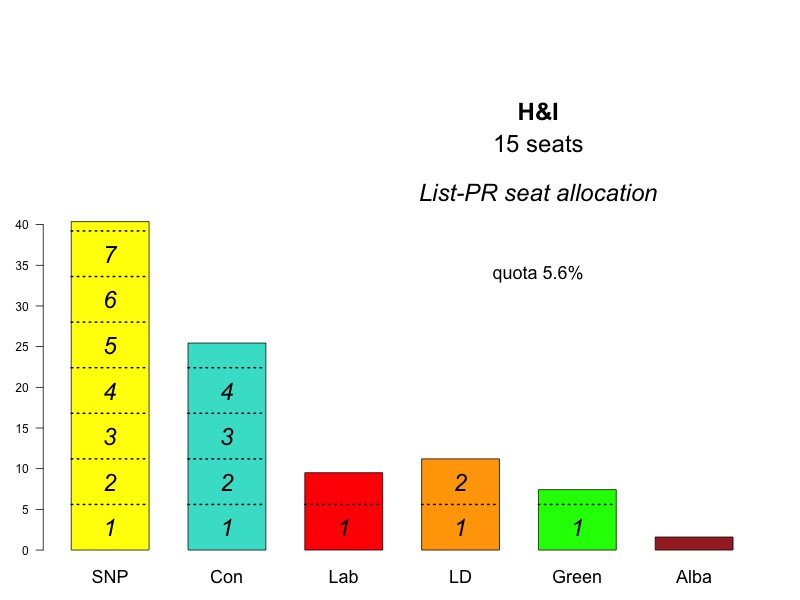
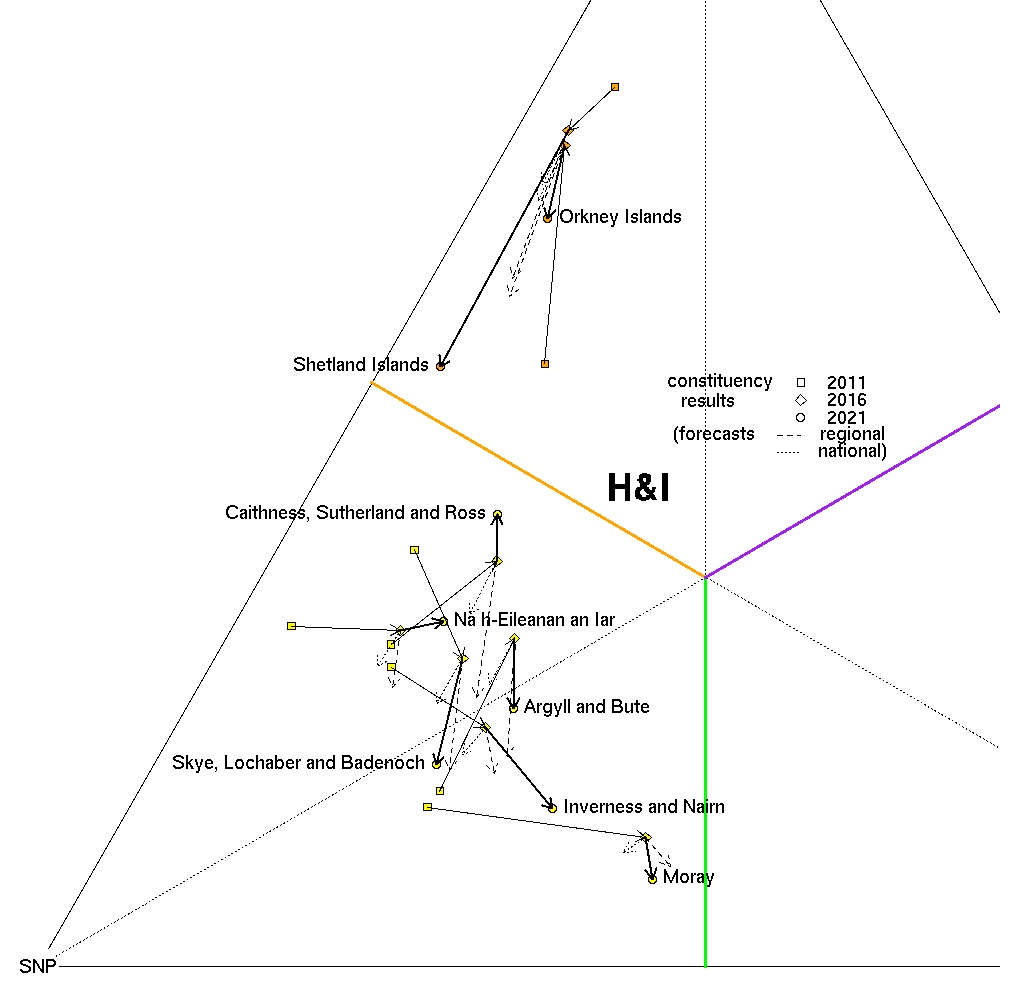
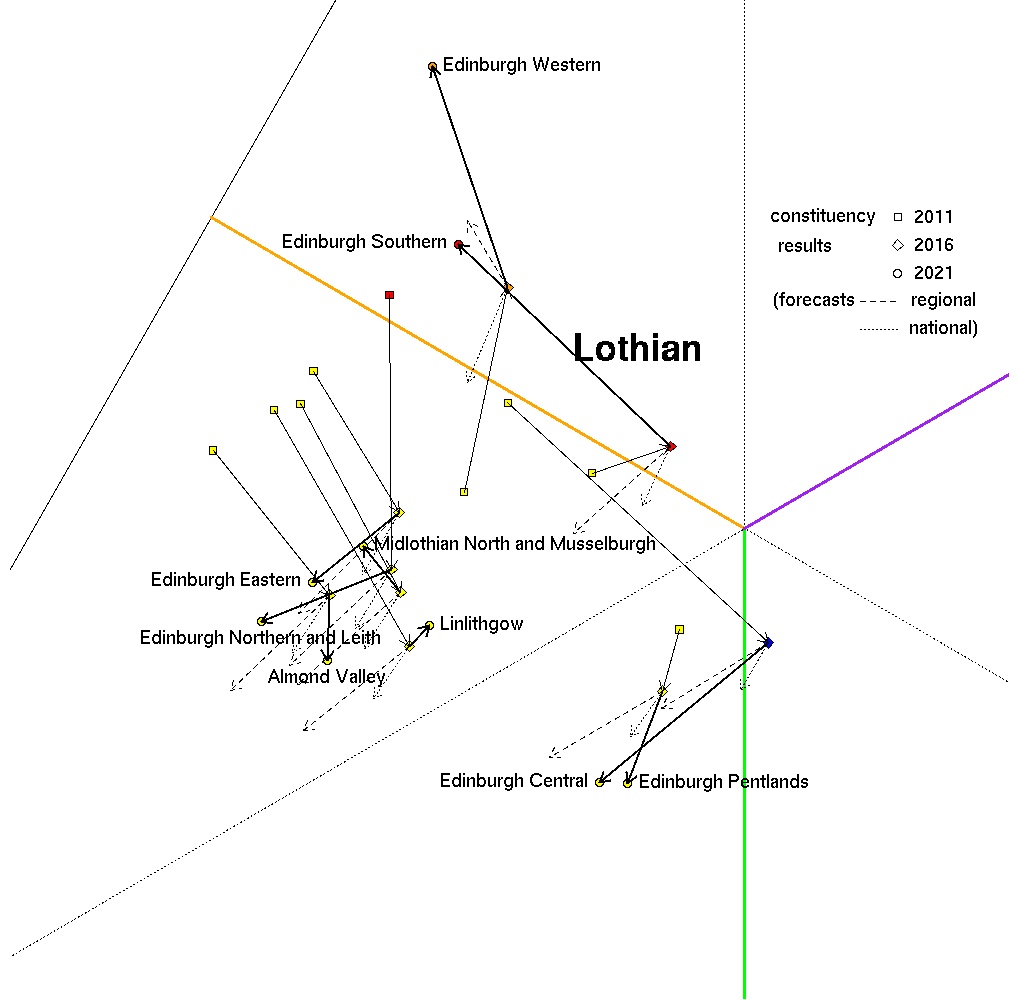
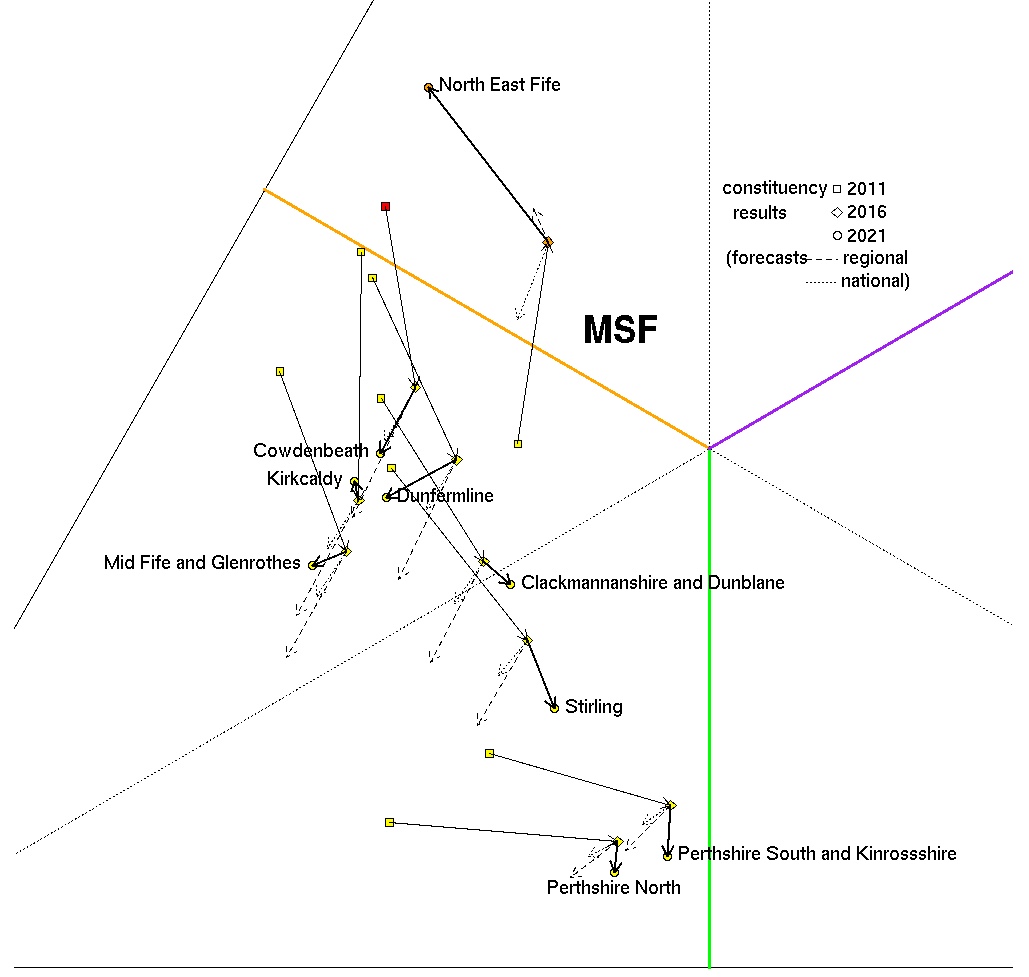
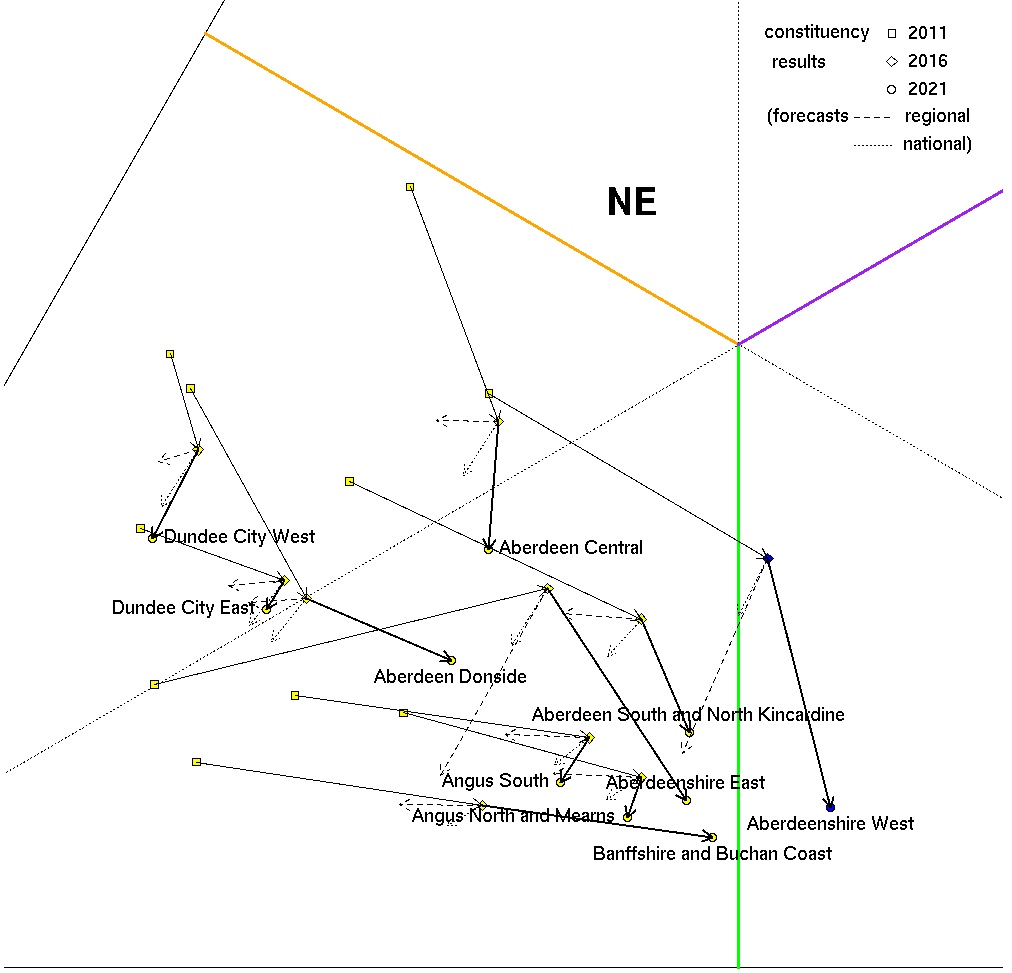
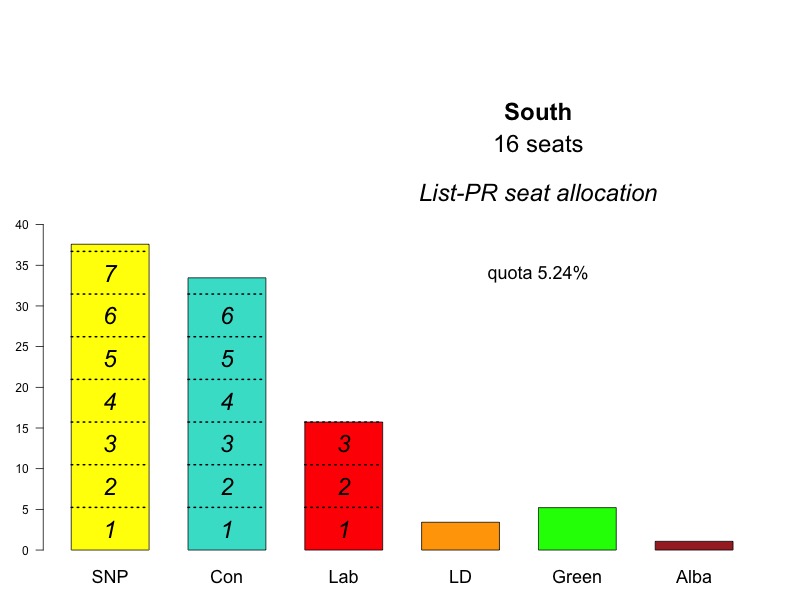
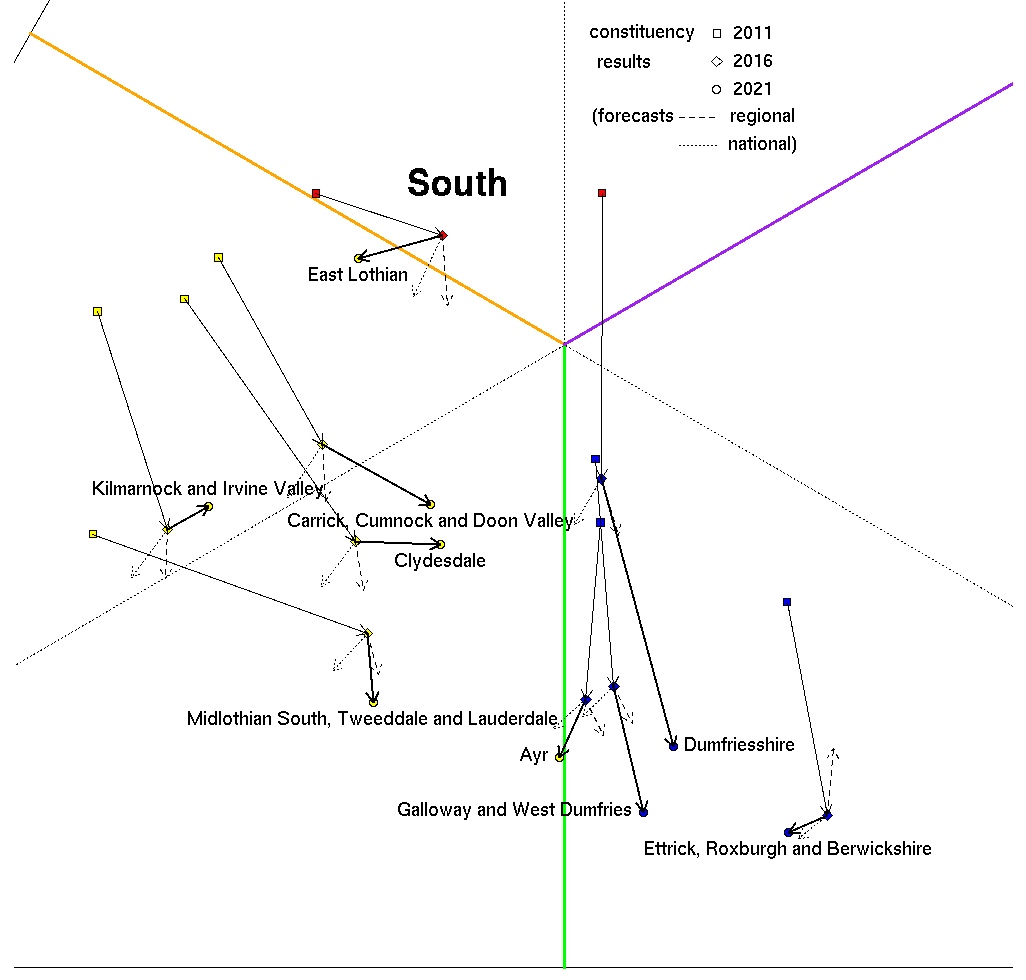
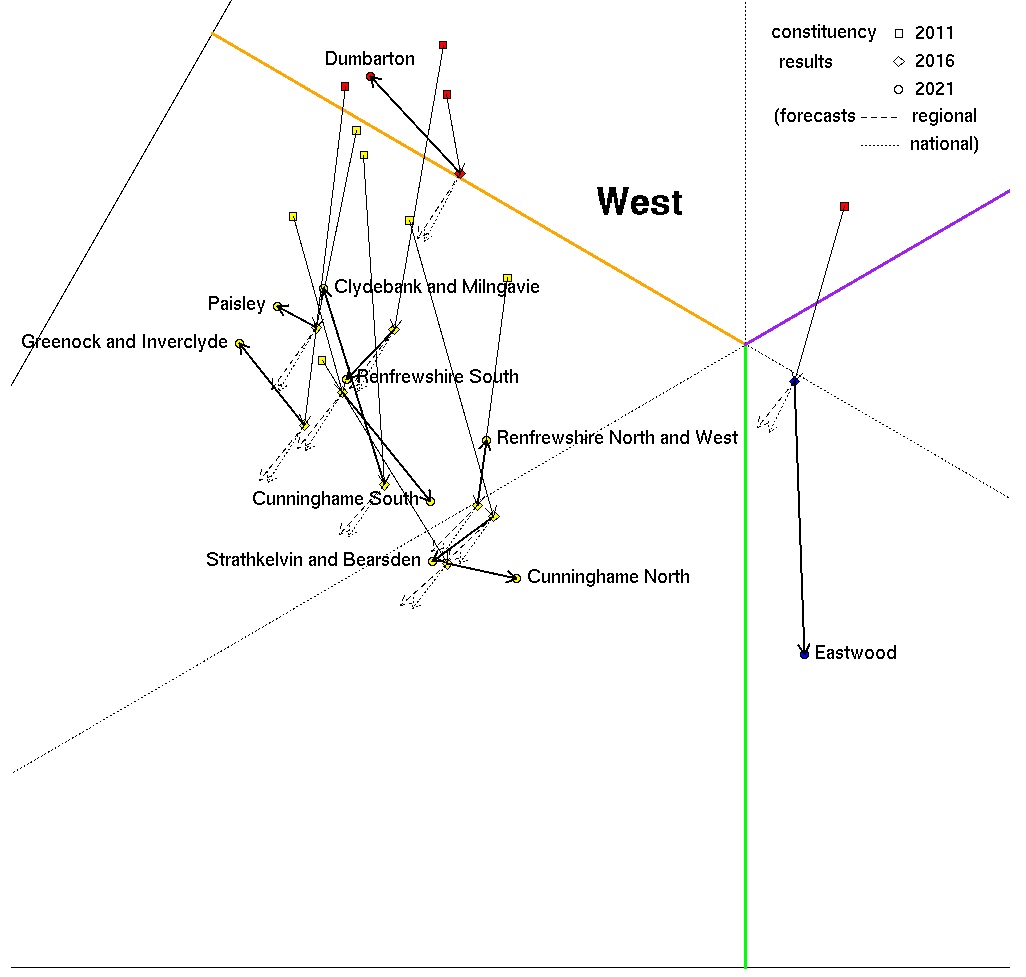
For each region the following figures show, from left to right:
(1) how seats would have been allocated on a pure list-PR system,
(2) movements in the constituency votes of the top 3 parties over the last
3 elections, and (3) the final allocation of votes in 2021 when the
constituency results are taken into account.
As exaample, the constituency plot for Lothian shows clearly the
prevalence of tactical voting int the 3 marginal Edinburgh seats,
where large drops in the Conservative vote enabled the LDs and Labour
to hold their seats. The different result in the third marginal seat,
Edinburgh Central, is probably largely because their 2011 win was
something of an anomaly, a personal achievement by their leader Ruth
Davidson.
|
