eMouse Atlas Project
BISEL has a long standing association with the eMouse Atlas Project (EMAP).
EMAP has two interrelated components: an atlas modelling the development of the embryonic mouse (EMA) and a gene expression database built on top of the atlas (EMAGE).

The "mouse" in EMAP is the developmental (embryonic) mouse. Initially, EMAP provided an anatomy that documented the changes in the mouse anatomy from conception until birth.
Development takes around 19 days, this interval is split into individual stages of development called Theiler Stages. Each stage has an anatomy within EMAP.
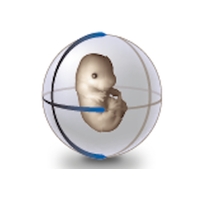
Additionally, most stages now have 3D models (the model for TS20 is shown on the right).
EMA is the combination of the models and the anatomy.
EMAGE republishes the results of in situ hybridisation gene expression experiments (see wikipedia definition).
Two different types of results are published. Textual annotations use the EMAP anatomy to describe the location of gene expression, e.g., the gene bmp4 is expressed in the future brain.
Spatial annotations use the EMA 3D models, e.g., the video on the right uses the model for TS17 to show where the family of Wnt genes is expressed:
EMAP and BISEL have collaborated on a number of projects including:
- PHenoImageShare
- CUBIST
- Argudas
- Sealife
© 2005- BISEL, School of Mathematical and Computer Sciences, Heriot-Watt University, Edinburgh, Scotland.