Visualisation | Anatomy
Comparison | Tree Display | 3D and Other Plots
Visualisation
The
data used in the XSPAN project, in keeping with most
areas of bioinformatics, is complex and comes in large
sets. The anatomies are all hierarchical, but
when more than one type of relationship, e.g. "part-of"
and "becomes" is used, they become very complex.
Visualisation
of the data is key to the functionality that we
wish to achieve. However, the degree of complexity of
interaction
between the different data sets requires the development
of unique solutions to allow display of and navigation
through these data sets.
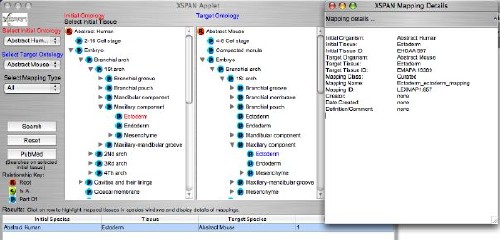
Screenshot
of the XSPAN user interface showing comparison of anatomies.
The
experience of the members of the Image Systems Engineering
Laboratory (ISEL)
at Heriot-Watt University have been drawn on to gather
requirements, design and evaluate the visualisation and
HCI issues necessary for development of a successful Graphical
User Interfaces (GUIs).
The
GUIs have been developed as a separate layer in XSPAN,
using middleware to communicate
with the databases and data warehouse. This will allow
other users to adapt existing GUIs or develop new
GUIs for specialist applications.
Java
1.4 is being used for the main GUI development, using
both applets and applications, and VRML and other technologies
for more specific applications.
Further
details of the visualisation issues can be seen by clicking
on the menu at the top or bottom of each page.
Next
> Visualisation | Anatomy
Comparison | Tree Display | 3D
and Other Plots |